
Analytics
The numbers, next to the work.
Visitors, sessions, sources, pages, devices, and countries — read in the same workspace as the audits and the queue that changed them, instead of in a dashboard nobody opens between reports.
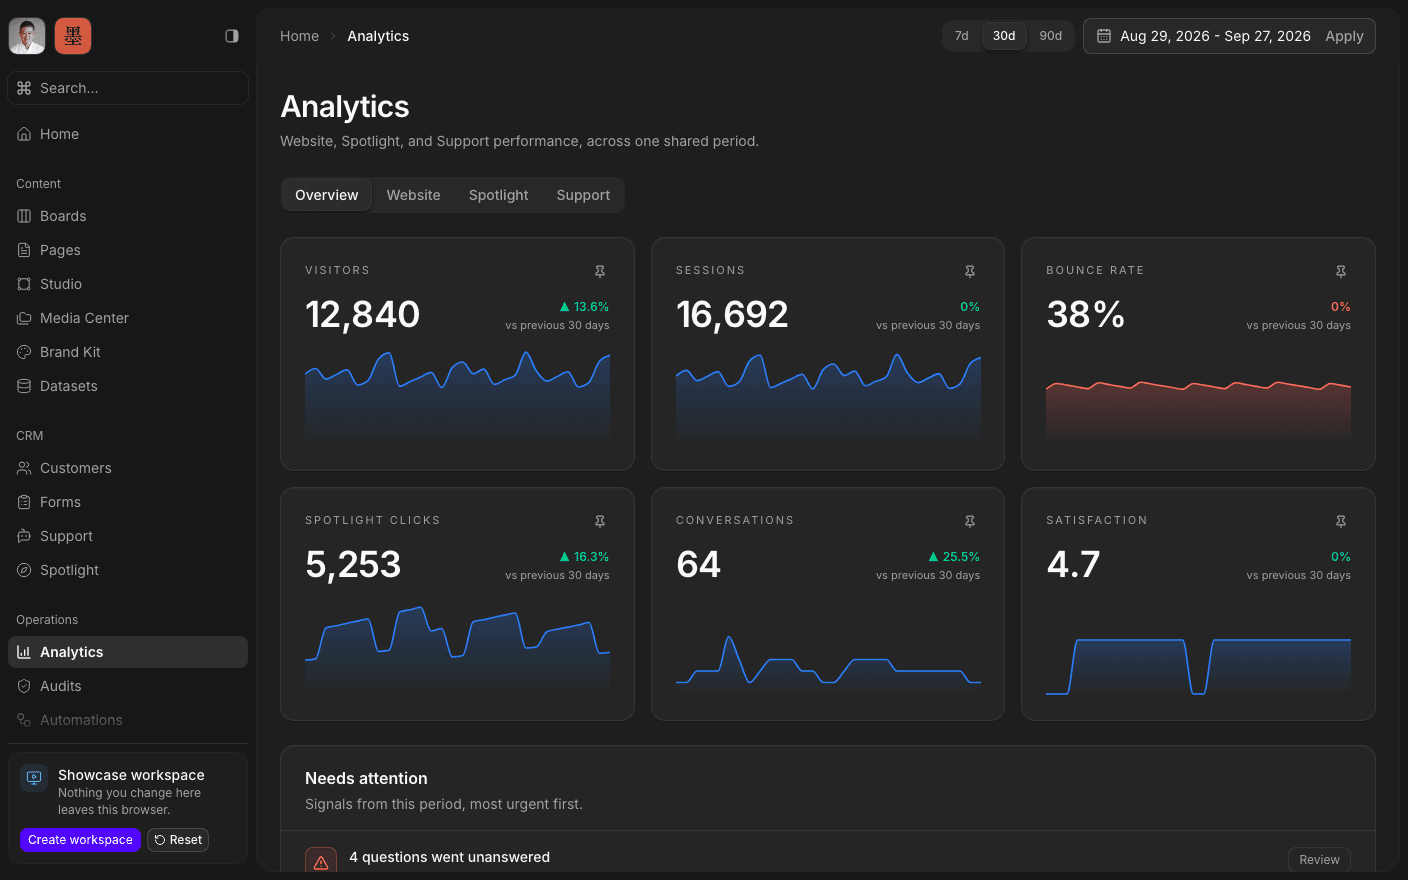
Press play to run the real interface right here — made-up data, in your browser, and nothing you do in it leaves the tab.
Not another report.
The complaint clients make about agency reporting is not that there are no numbers. It is that the numbers arrive monthly, in a slide, disconnected from anything anyone did. Here the dashboard is open all the time, in the workspace where the work that moved it is also visible.
Five headline figures — visitors, page views, sessions, average session duration, and bounce rate — each with a change against the previous equal-length period and a sparkline, so the number carries its own direction. Then the breakdowns: visitors over time against the previous period, traffic sources, top pages, devices, countries, new versus returning, top referrers, and active users.
SharpHaw connects the analytics project; you read the result. There is nothing to install and no tag to add on your side.
Inside Analytics
Read the headline figures
Visitors, views, sessions, duration, and bounce rate.
See the direction
A change against the previous period on every figure.
Compare over time
Visitors charted against the equivalent period before.
Break it down
Sources, devices, countries, and new versus returning.
Find your top pages
Which pages and referrers are actually working.
Check uptime
A rolling status summary beside the traffic.
Open the dashboard.
Book a 30-minute call. We'll go through what's working, what isn't, and what the first move should be. If we're not the right fit, we'll say so on the call.